一,下载安装包并解压
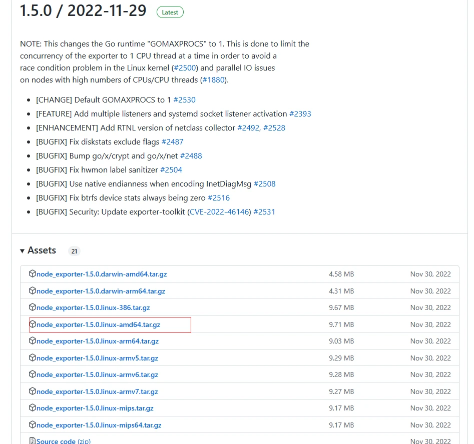
下载地址: https://github.com/prometheus/node_exporter/releases
同样物理机上下载,然后上传到服务器,本次安装使用的版本为:node_exporter-1.5.0.linux-amd64
1,根据服务器情况选择安装目录,上传安装包。
cd /prometheus
#解压
tar -xvzf node_exporter-1.5.0.linux-amd64.tar.gz
mv node_exporter-1.5.0.linux-amd64 node_exporter
cd node_exporter

二,进行系统service编写
-
创建
node_exporter.service配置文件cd /usr/lib/systemd/system vim node_exporter.service
-
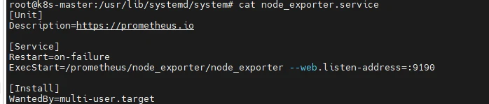
node_exporter.service 文件填入如下内容后保存
:wq[Unit] Description=https://prometheus.io
[Service] Restart=on-failure ExecStart=/prometheus/node_exporter/node_exporter --web.listen-address=:9190
[Install] WantedBy=multi-user.target
-
查看配置文件
-
刷新服务配置并启动服务
systemctl daemon-reload systemctl start node_exporter.service
-
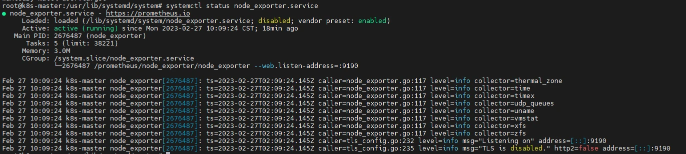
查看服务运行状态
systemctl status node_exporter.service
-
设置开机自启动
systemctl enable node_exporter.service

-
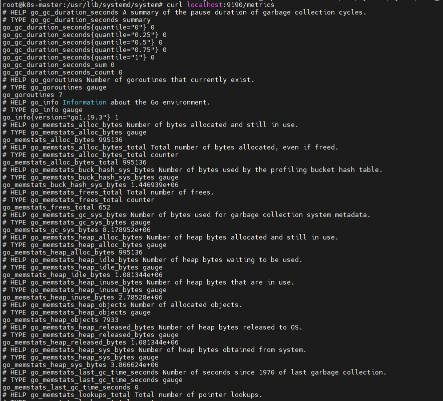
测试服务返回
curl localhost:9190/metrics
三,对接prometheus
-
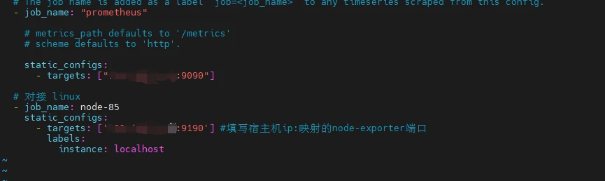
打开prometheus.yml,增加如下配置(9100会与elasticsearch端口冲突,推荐映射为9190)
#进入Prometheus安装目录 cd /prometheus/prometheus/ vim prometheus.yml #添加如下内容
# 对接 linux
- job_name: linux
  static_configs:
    - targets: ['11x.xx.xx.7:9190'] #填写宿主机ip:映射的node-exporter端口
      labels:
        instance: localhost
-
执行prometheus配置刷新
curl -XPOST localhost:9090/-/reload
-
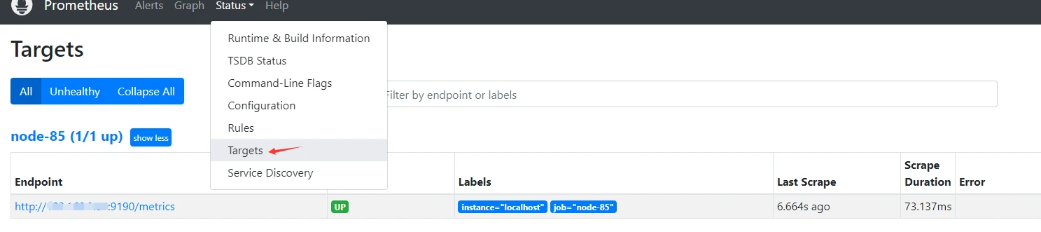
打开prometheus,点击Status-Targets,可以看到node节点已经监听到
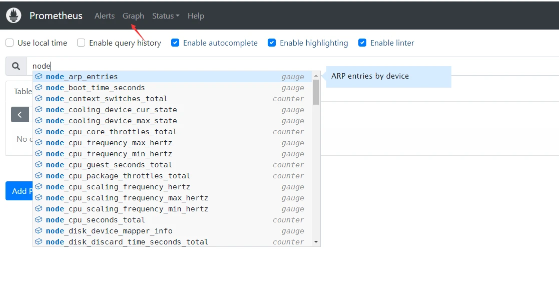
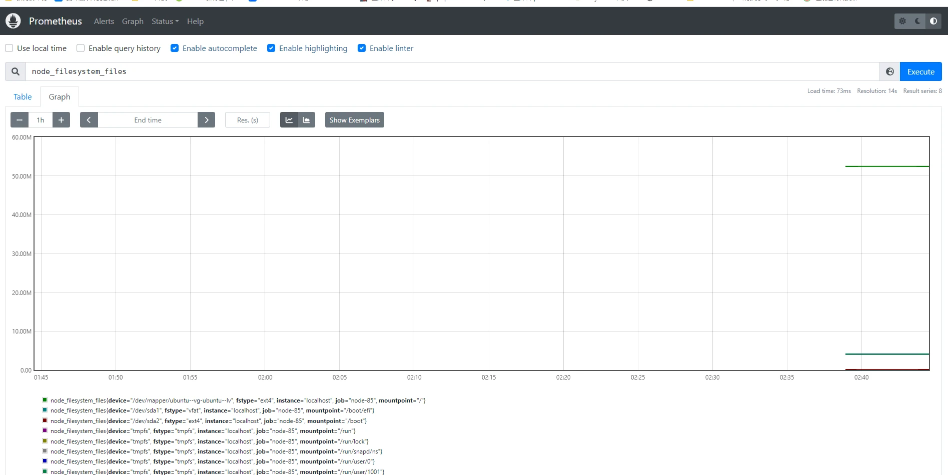
- 点击Graph,输入node后,可以看到出现了很多node指令
- 至此,node-exporter插件安装完毕,但是现目前的监控数据显示并不是很友好所以需要对接Grafana,导入监控大屏。如需监视其他服务器,按照此安装教程部署配置,同时记得开放防火墙对应端口
本文来自极简博客,作者:温柔守护,转载请注明原文链接:Prometheus使用:NodeExporter插件安装